![Canadians more positive about debt situation compared to year ago [Ipsos]](https://pollingguru.ca/wp-content/uploads/2017/12/2017-12-Ipsos-Household-Debt-Year-Over-Year-768x576.jpg "Canadians more positive about debt situation compared to year ago [Ipsos]")
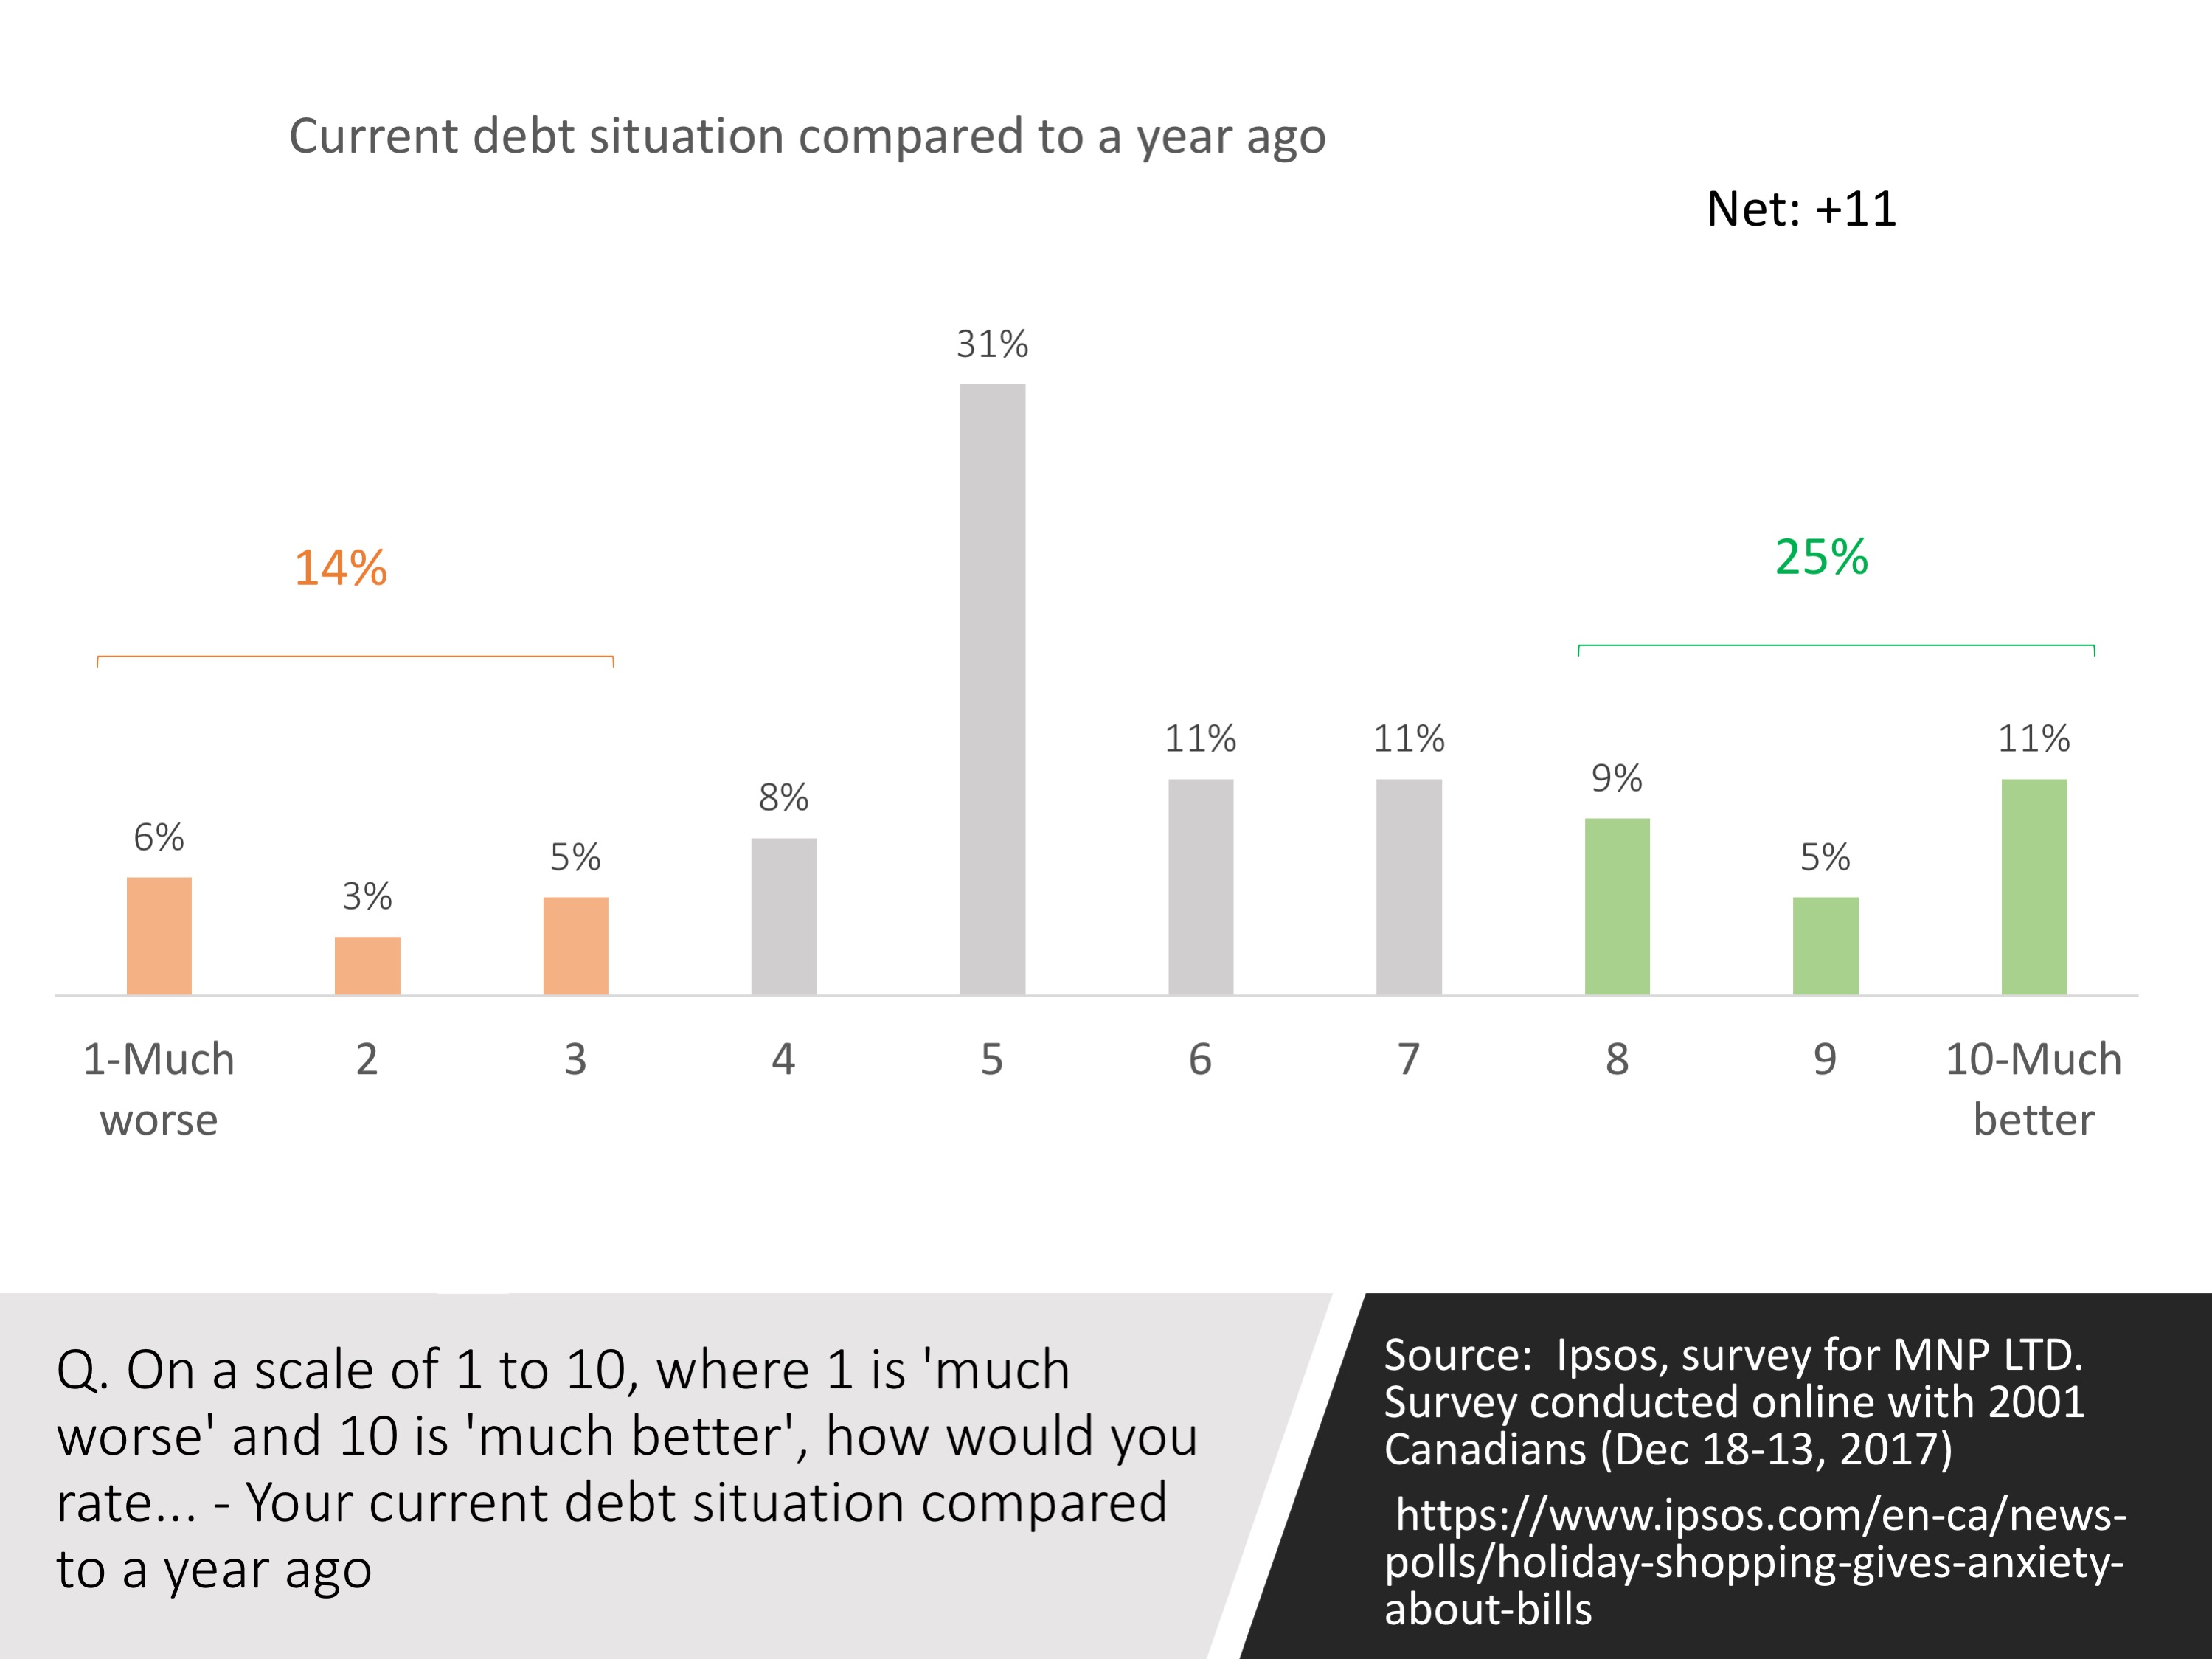
It seems counterintuitive. Twenty-five per cent of Canadians think their debt situation is better today than it was a year ago (using top 3 box on 10 point scale). In comparison, only 14% are in a worse situation. Counterintuitive given rising house prices has made affordability a serious challenge and other independent sources that suggest that Canadians are as indebted as ever (see Toronto Star article).
Is the positivity just misplaced optimism? Or, perhaps it is a reflection of consumer confidence that has made Canadians feel that the debt (while rising in real terms) has become more manageable. Certainly the most recent Nanos-Bloomberg results suggest a confident political environment. Undermining the confidence argument is the recent Nanos CTV poll that shows the economy has a top Canadian priority.
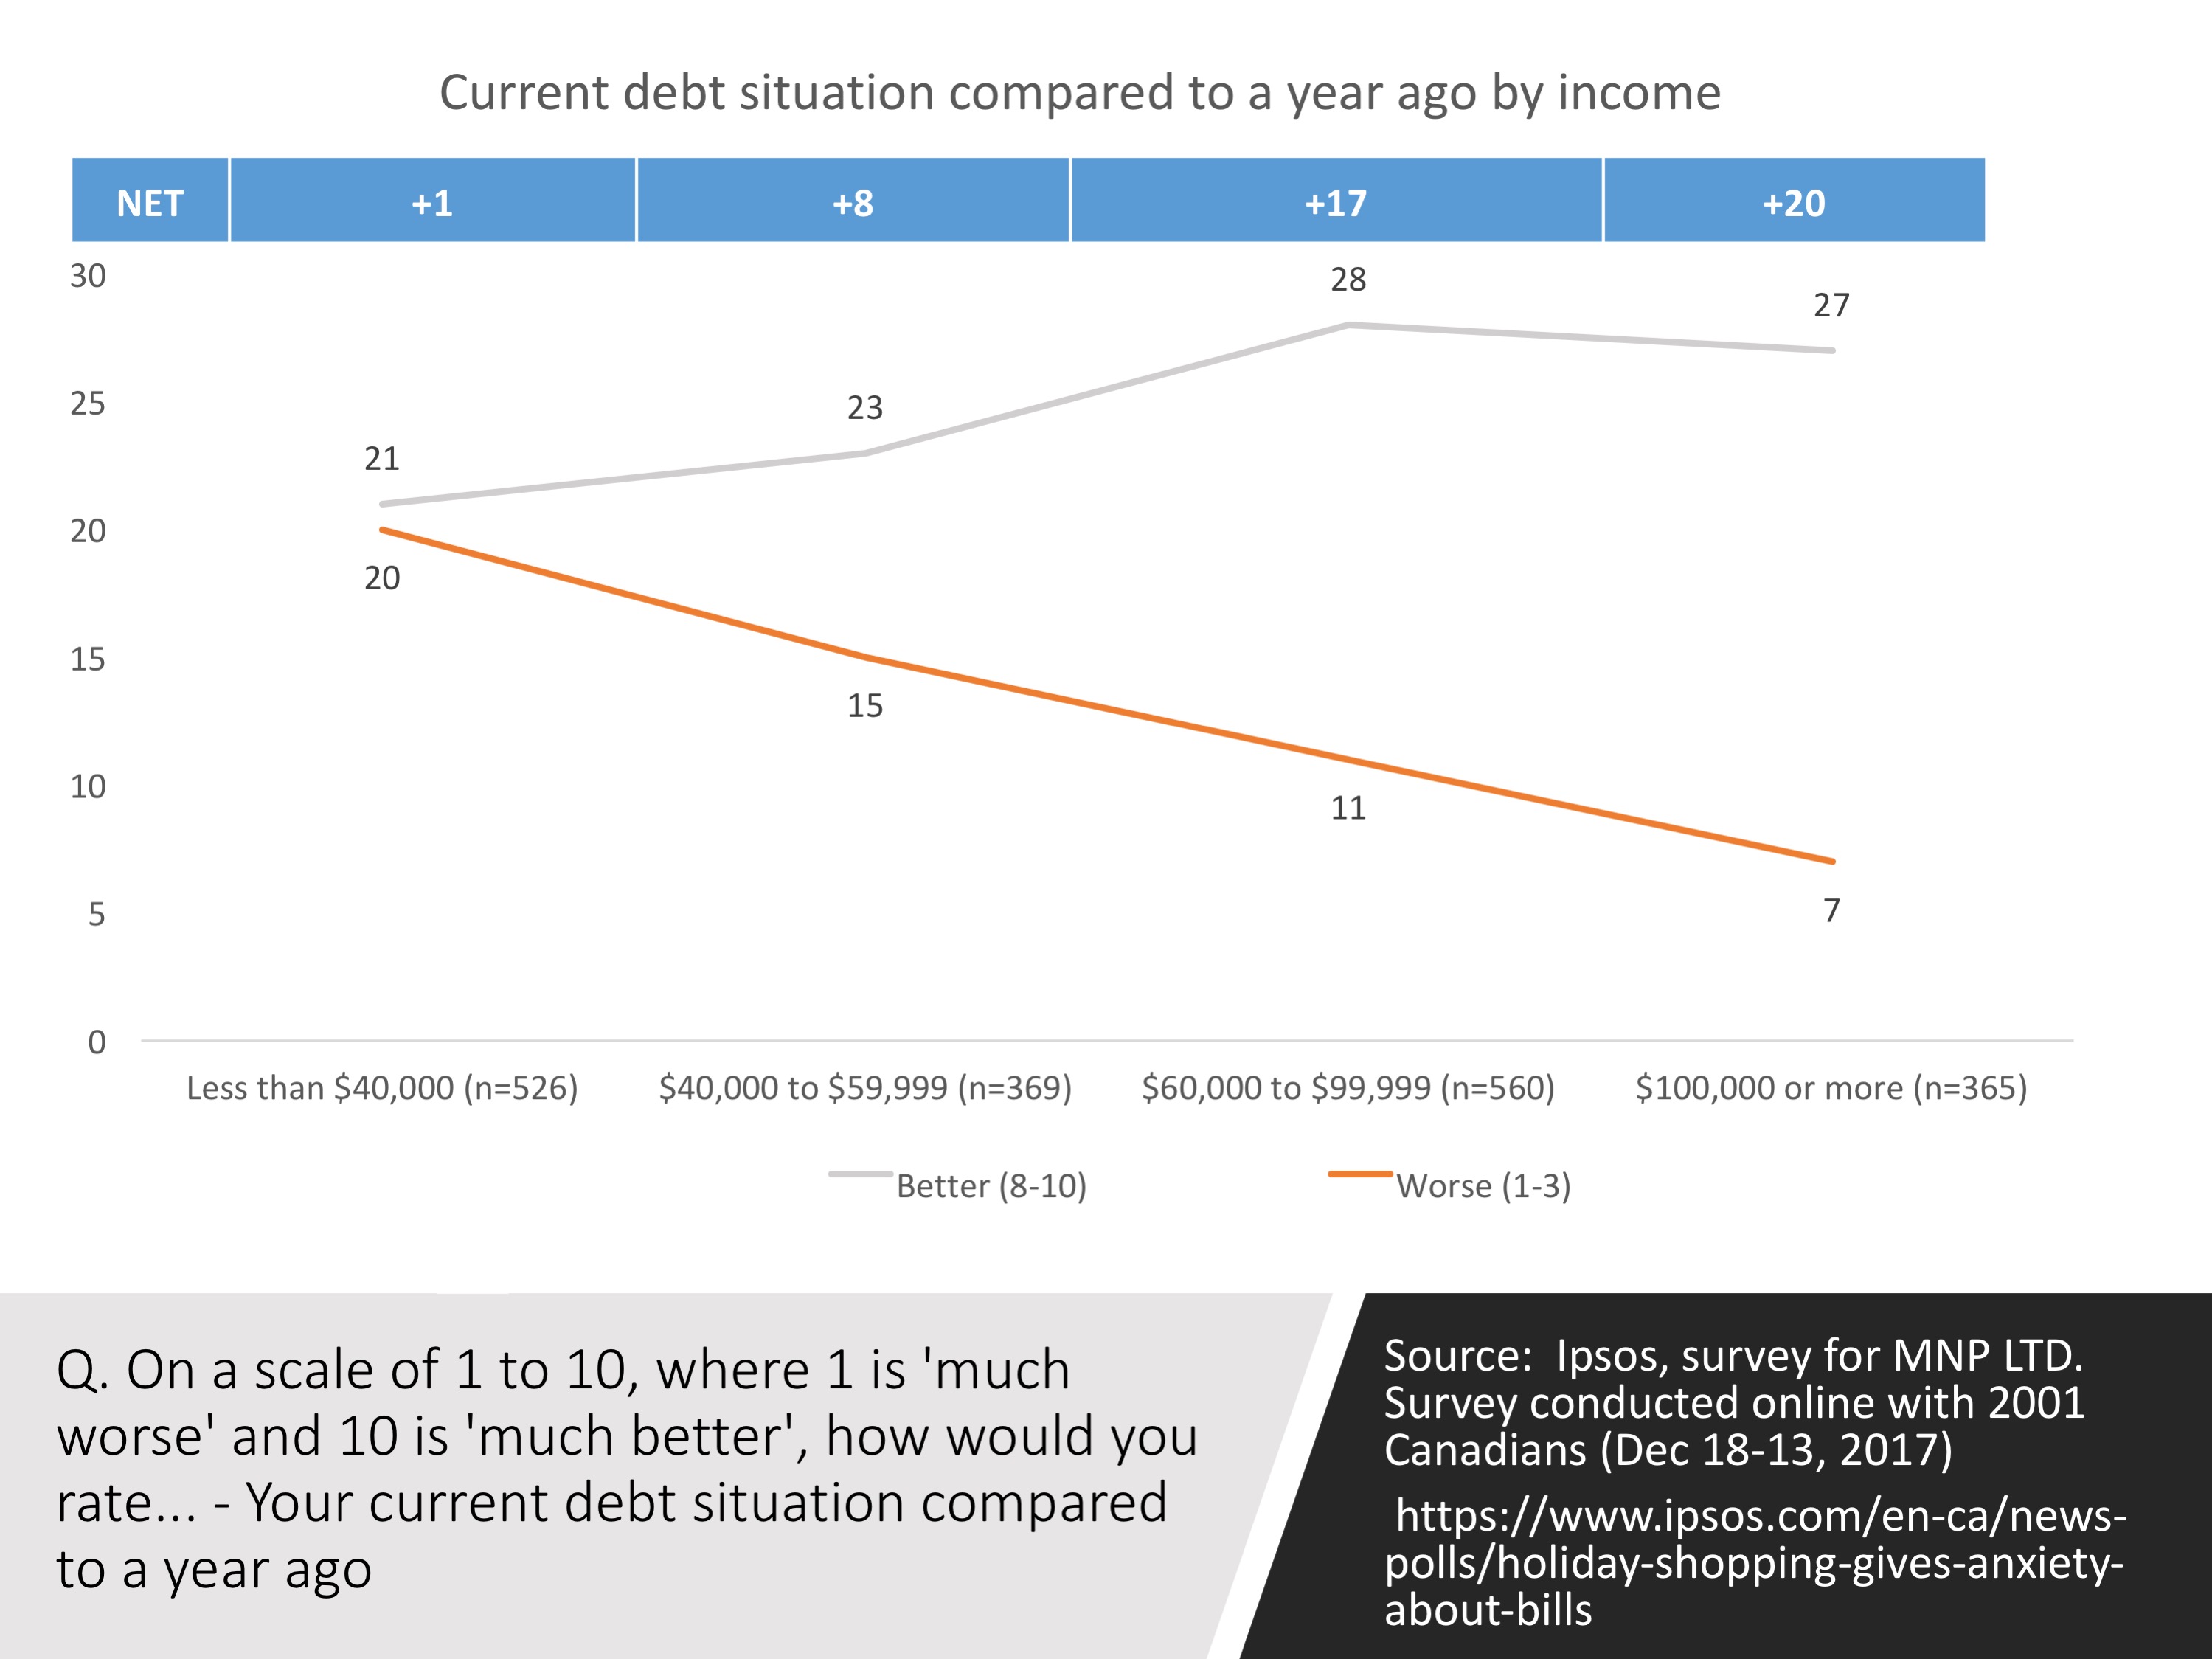
While these offer some potential reasons, the most notable finding is the wide discrepancy in how Canadians of different income levels perceive the debt situation. As income rises the feeling that the debt situation is worse declines so that the net feeling about household debt (% better – % worse) goes from a mere +1 among the smallest income group to +20 among the highest. Further indication of the vulnerability that the lowest income groups feel in Canada and, perhaps, the overconfidence that the higher income groups feel.
Note on scale. Consistent with the original reporting, the analysis here focuses on the top 3 and bottom three scale points. A 10 point scale does not have a natural middle, so while “5” is the middle from a respondent view, it is not the true arithmetic middle. Using top 4 would produce the same results. If we used 5 as the middle the result would be, 47% better (6-10), 31% same (5) and 22% worse (1-4) but the better would have one additional category option.
The polling results discussed here were collected by Ipsos for MNP LTD.
Methodology: “These are some of the findings of an Ipsos poll conducted between December 8th and December 13th, 2017 on behalf of MNP LTD. For this survey, a sample of 2,001 Canadians aged 18+ was interviewed. Weighting was then employed to balance demographics to ensure that the sample’s composition reflects that of the adult population according to Census data and to provide results intended to approximate the sample universe. The precision of Ipsos online polls is measured using a credibility interval. In this case, the poll is accurate to within ±2.5 percentage points, 19 times out of 20, had all Canadian adults been polled. The credibility interval will be wider among subsets of the population. All sample surveys and polls may be subject to other sources of error, including, but not limited to coverage error, and measurement error.”