![Few Canadians are Asked to Bribe a Government Official but Many See Bribes as Justified [AmericasBarometer]](https://pollingguru.ca/wp-content/uploads/2018/05/bribe-768x512.jpg "Few Canadians are Asked to Bribe a Government Official but Many See Bribes as Justified [AmericasBarometer]")
One in ten Canadians think that it is sometime acceptable to pay a bribe and few are actually asked for one by a government official. Comparatively, Canadians tend to reject the idea but young people, and in particular young men, are the most amenable to paying bribes.
The issue of paying bribes — a remuneration outside of the actual cost of the service, to get something one is not entitled to or to get it faster — would seem to be a topic not worth asking in Canada. A well education and compensated public service combined with an educated and well connected population should not be fertile ground for success at asking for of offering a bribe.
The first time I saw an RFP for a the multi-country survey, that included questions on bribes, I thought why waste time on a survey asking such a question in Canada — the answer had to be almost zero. In fact, the results are not zero.
Bribes
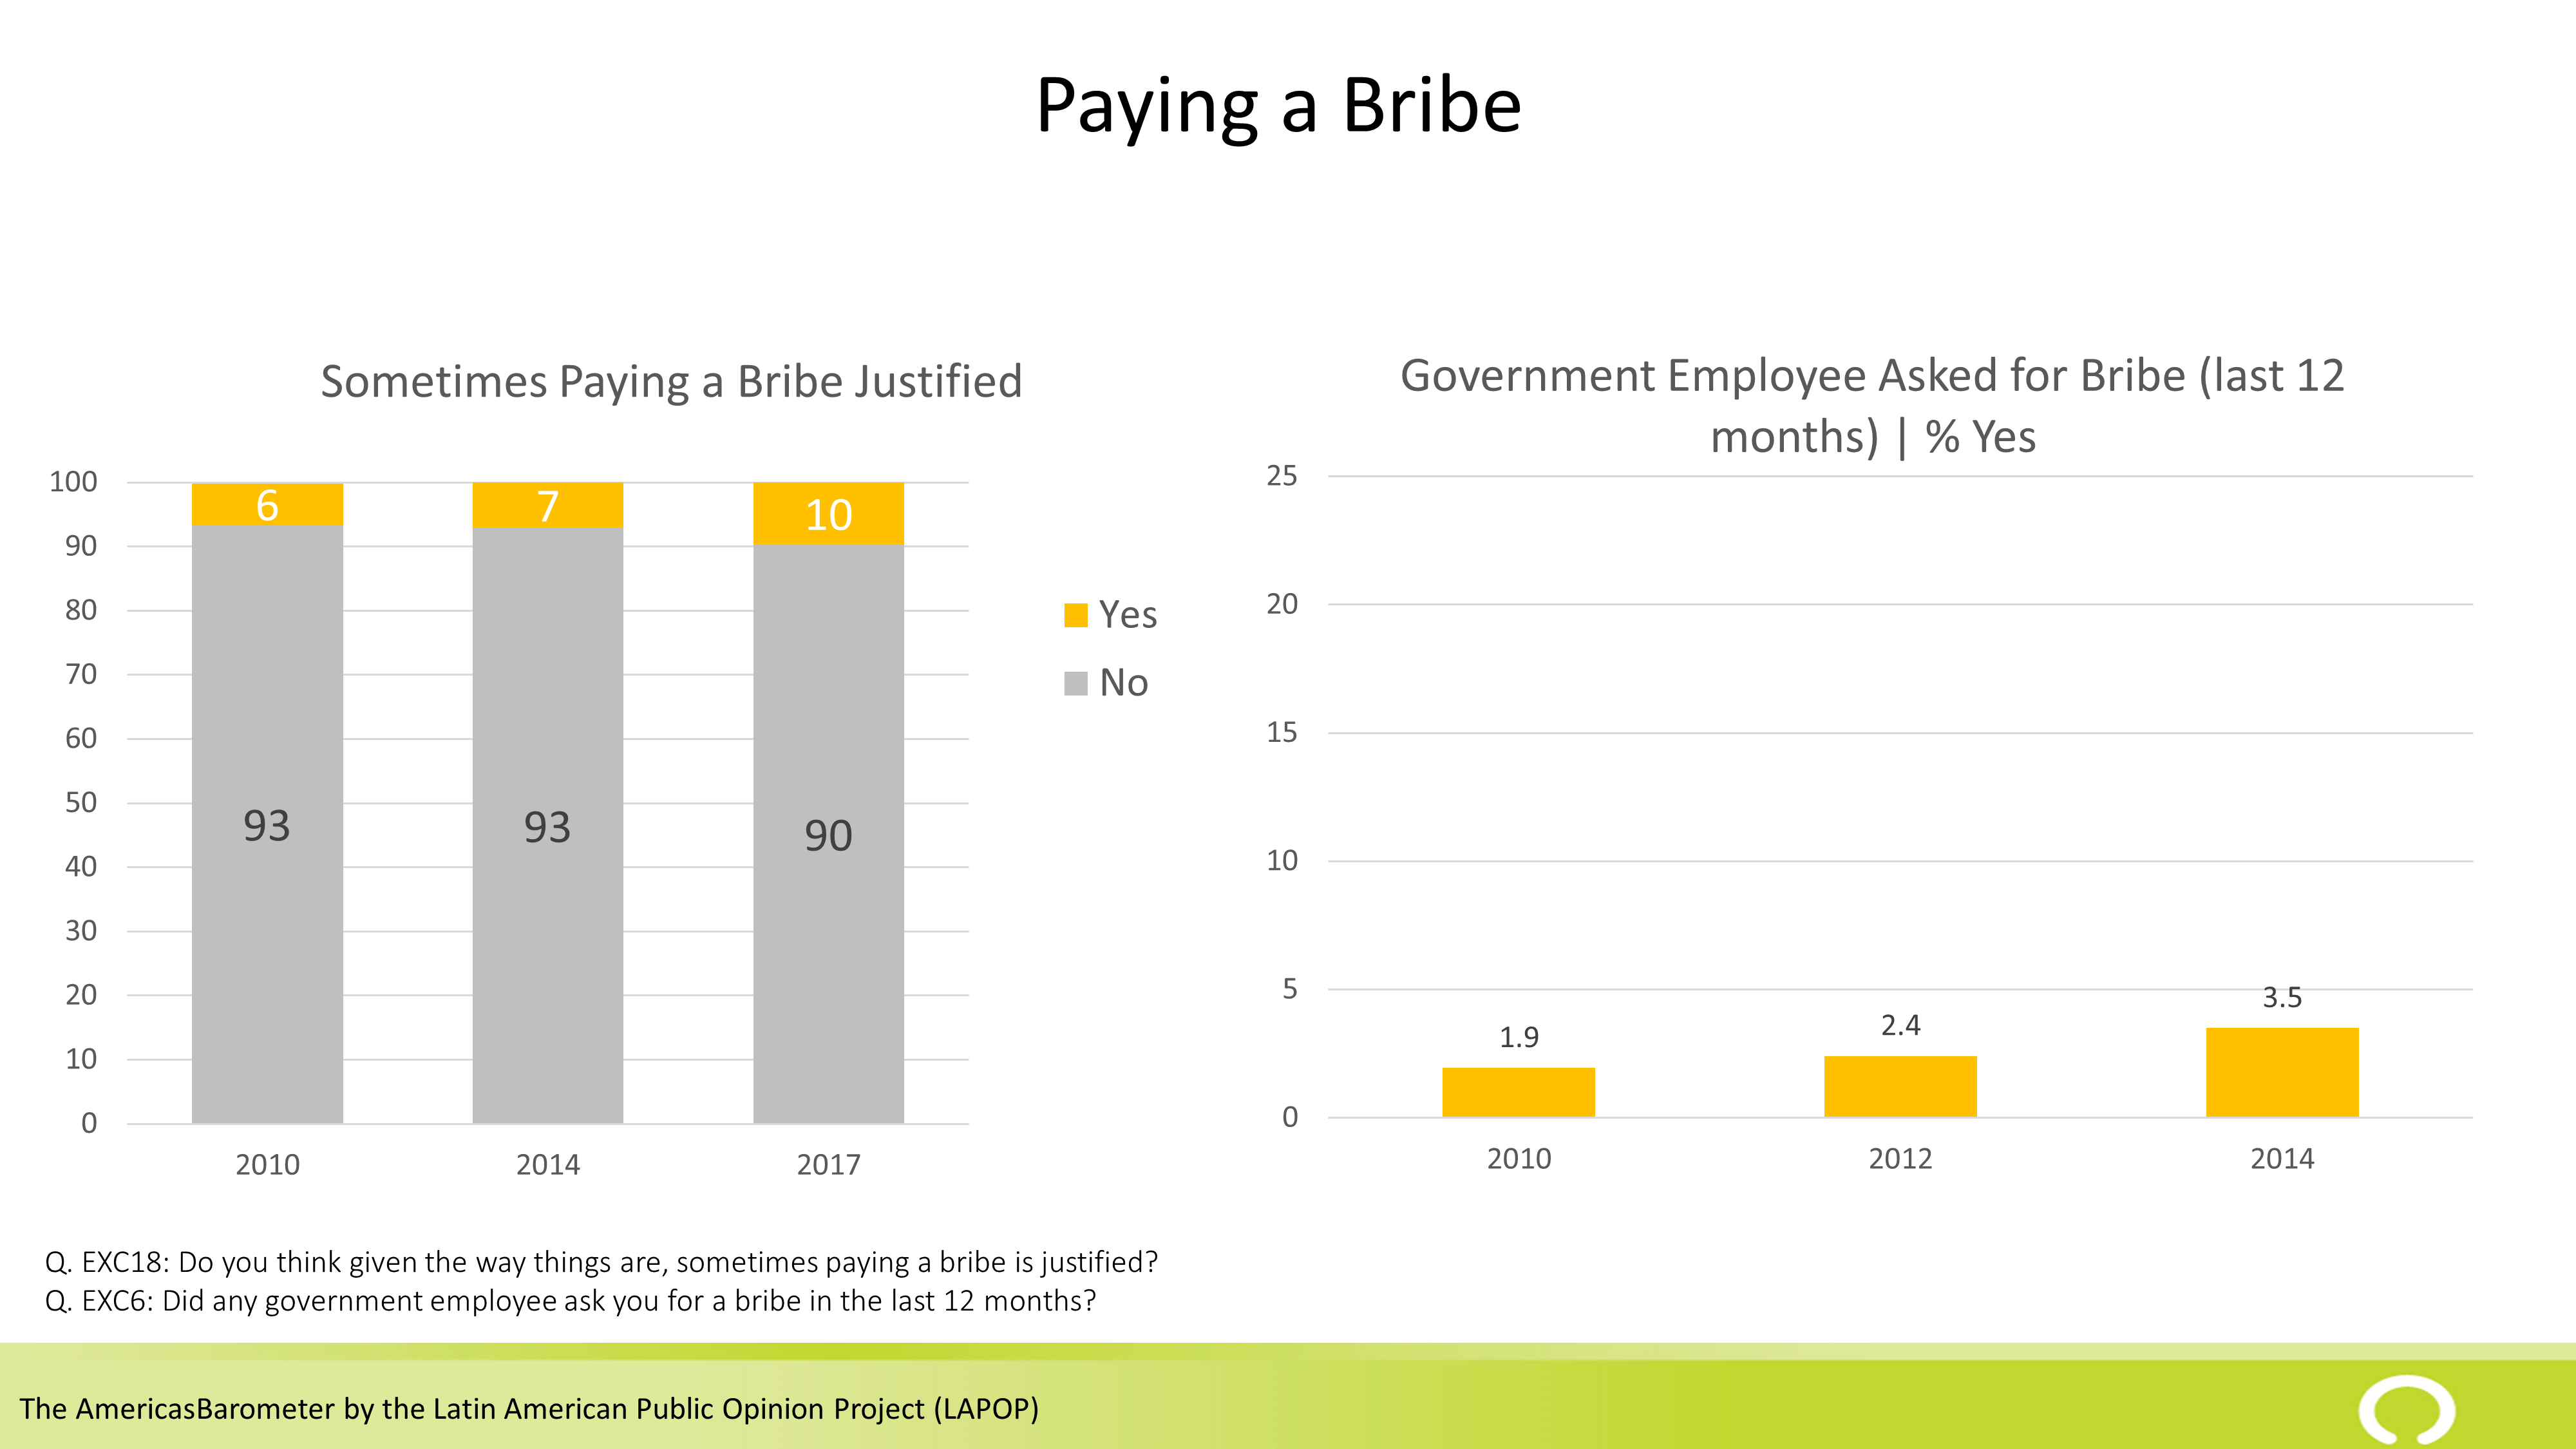
The results from two questions asked on the AmericaBarometer survey in Canada and a number of other questions shows that few Canadians feel that paying a bribe is sometimes justified. Canada ranks at the bottom of the 22 countries in terms of the share of the countries population that thinks bribes are justified.
Notably, the percentage of Canadians who think it is justified has risen from 6% in 2010 to 10% in 2017. The 10% who are willing to fundamentally change and even subvert the rules of the game for personal gain is not a trivial amount and the trend is worrying if it continues.
The percentage of Canadians in 2014 who have been asked for a bribe from an official is very low – 3.5%. At the same time it is not zero.
It may be that some of the 3.5% is accidental (mistakenly hitting yes instead of no) since the assumption that these respondent errors are possible on both sides may not be valid (in the extreme case, if no bribes were requested, the true value would be 100% ‘no’ and therefore no one who said ‘no’ could have answered ‘no’ when they should have answered yes” but all of those who answered ‘yes’ should have answered ‘no’). An error rate that is 3.5% seems, however, high and unlikely to be pure respondent error.
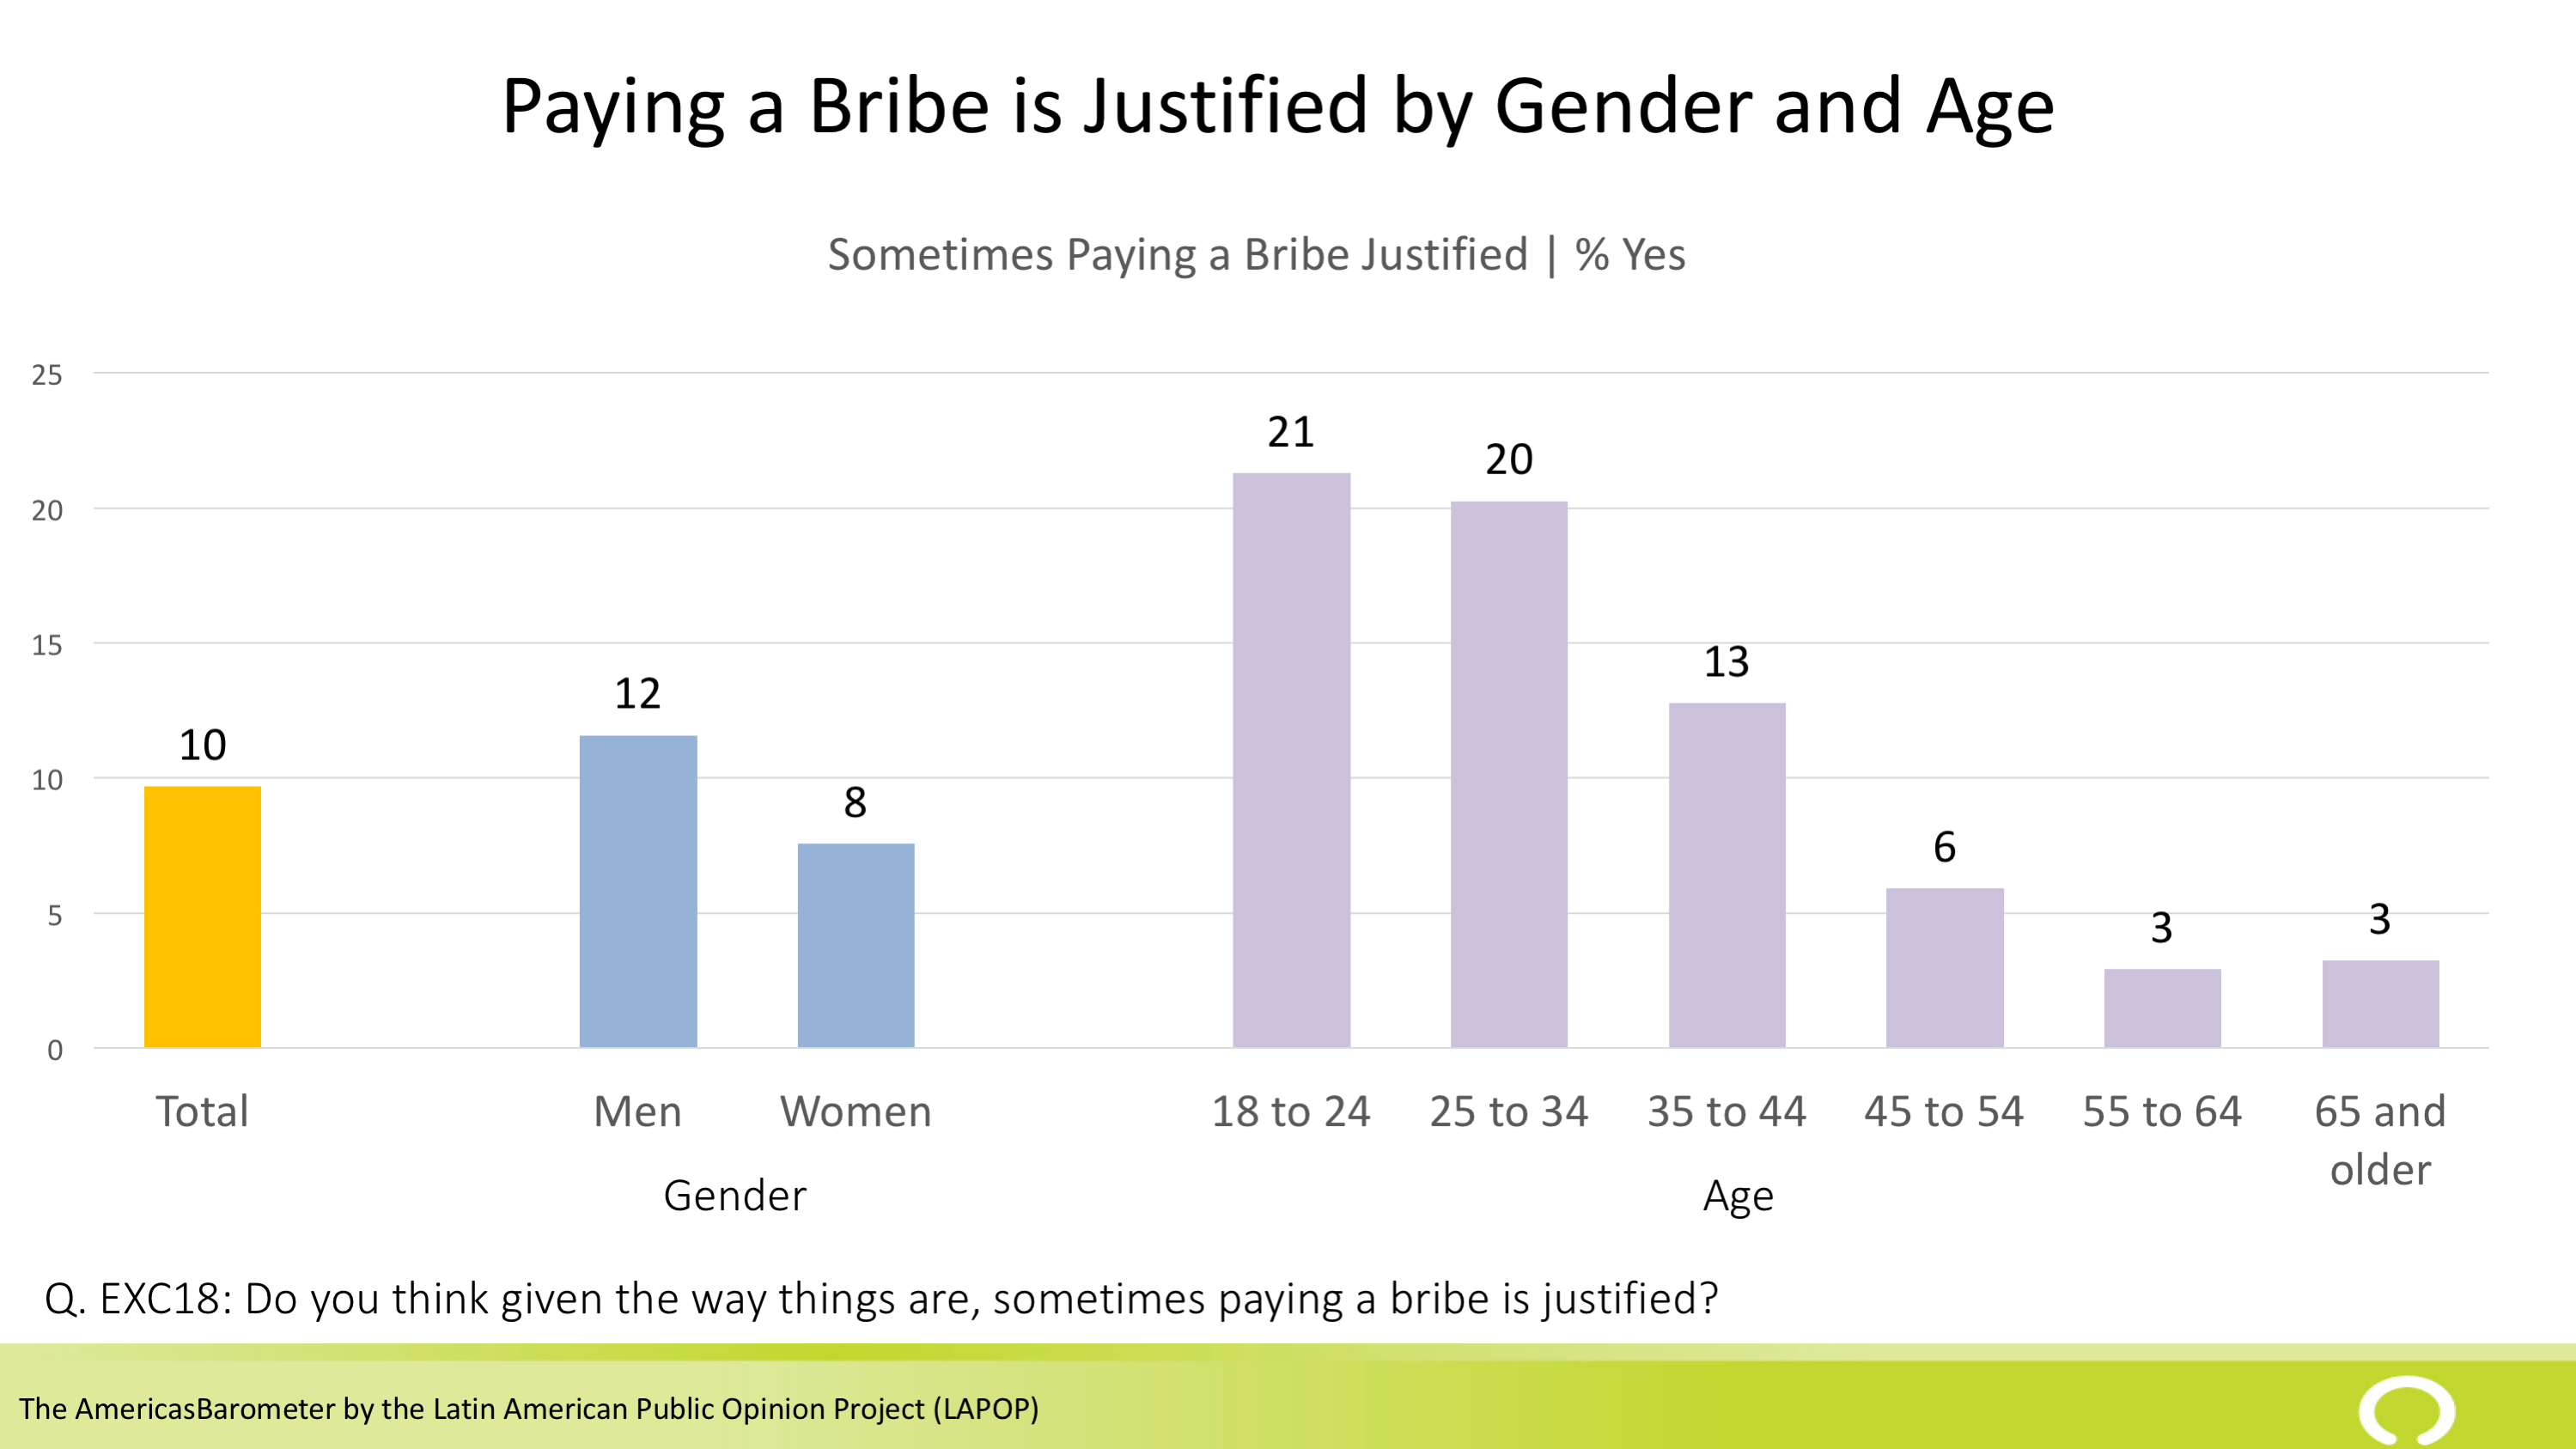
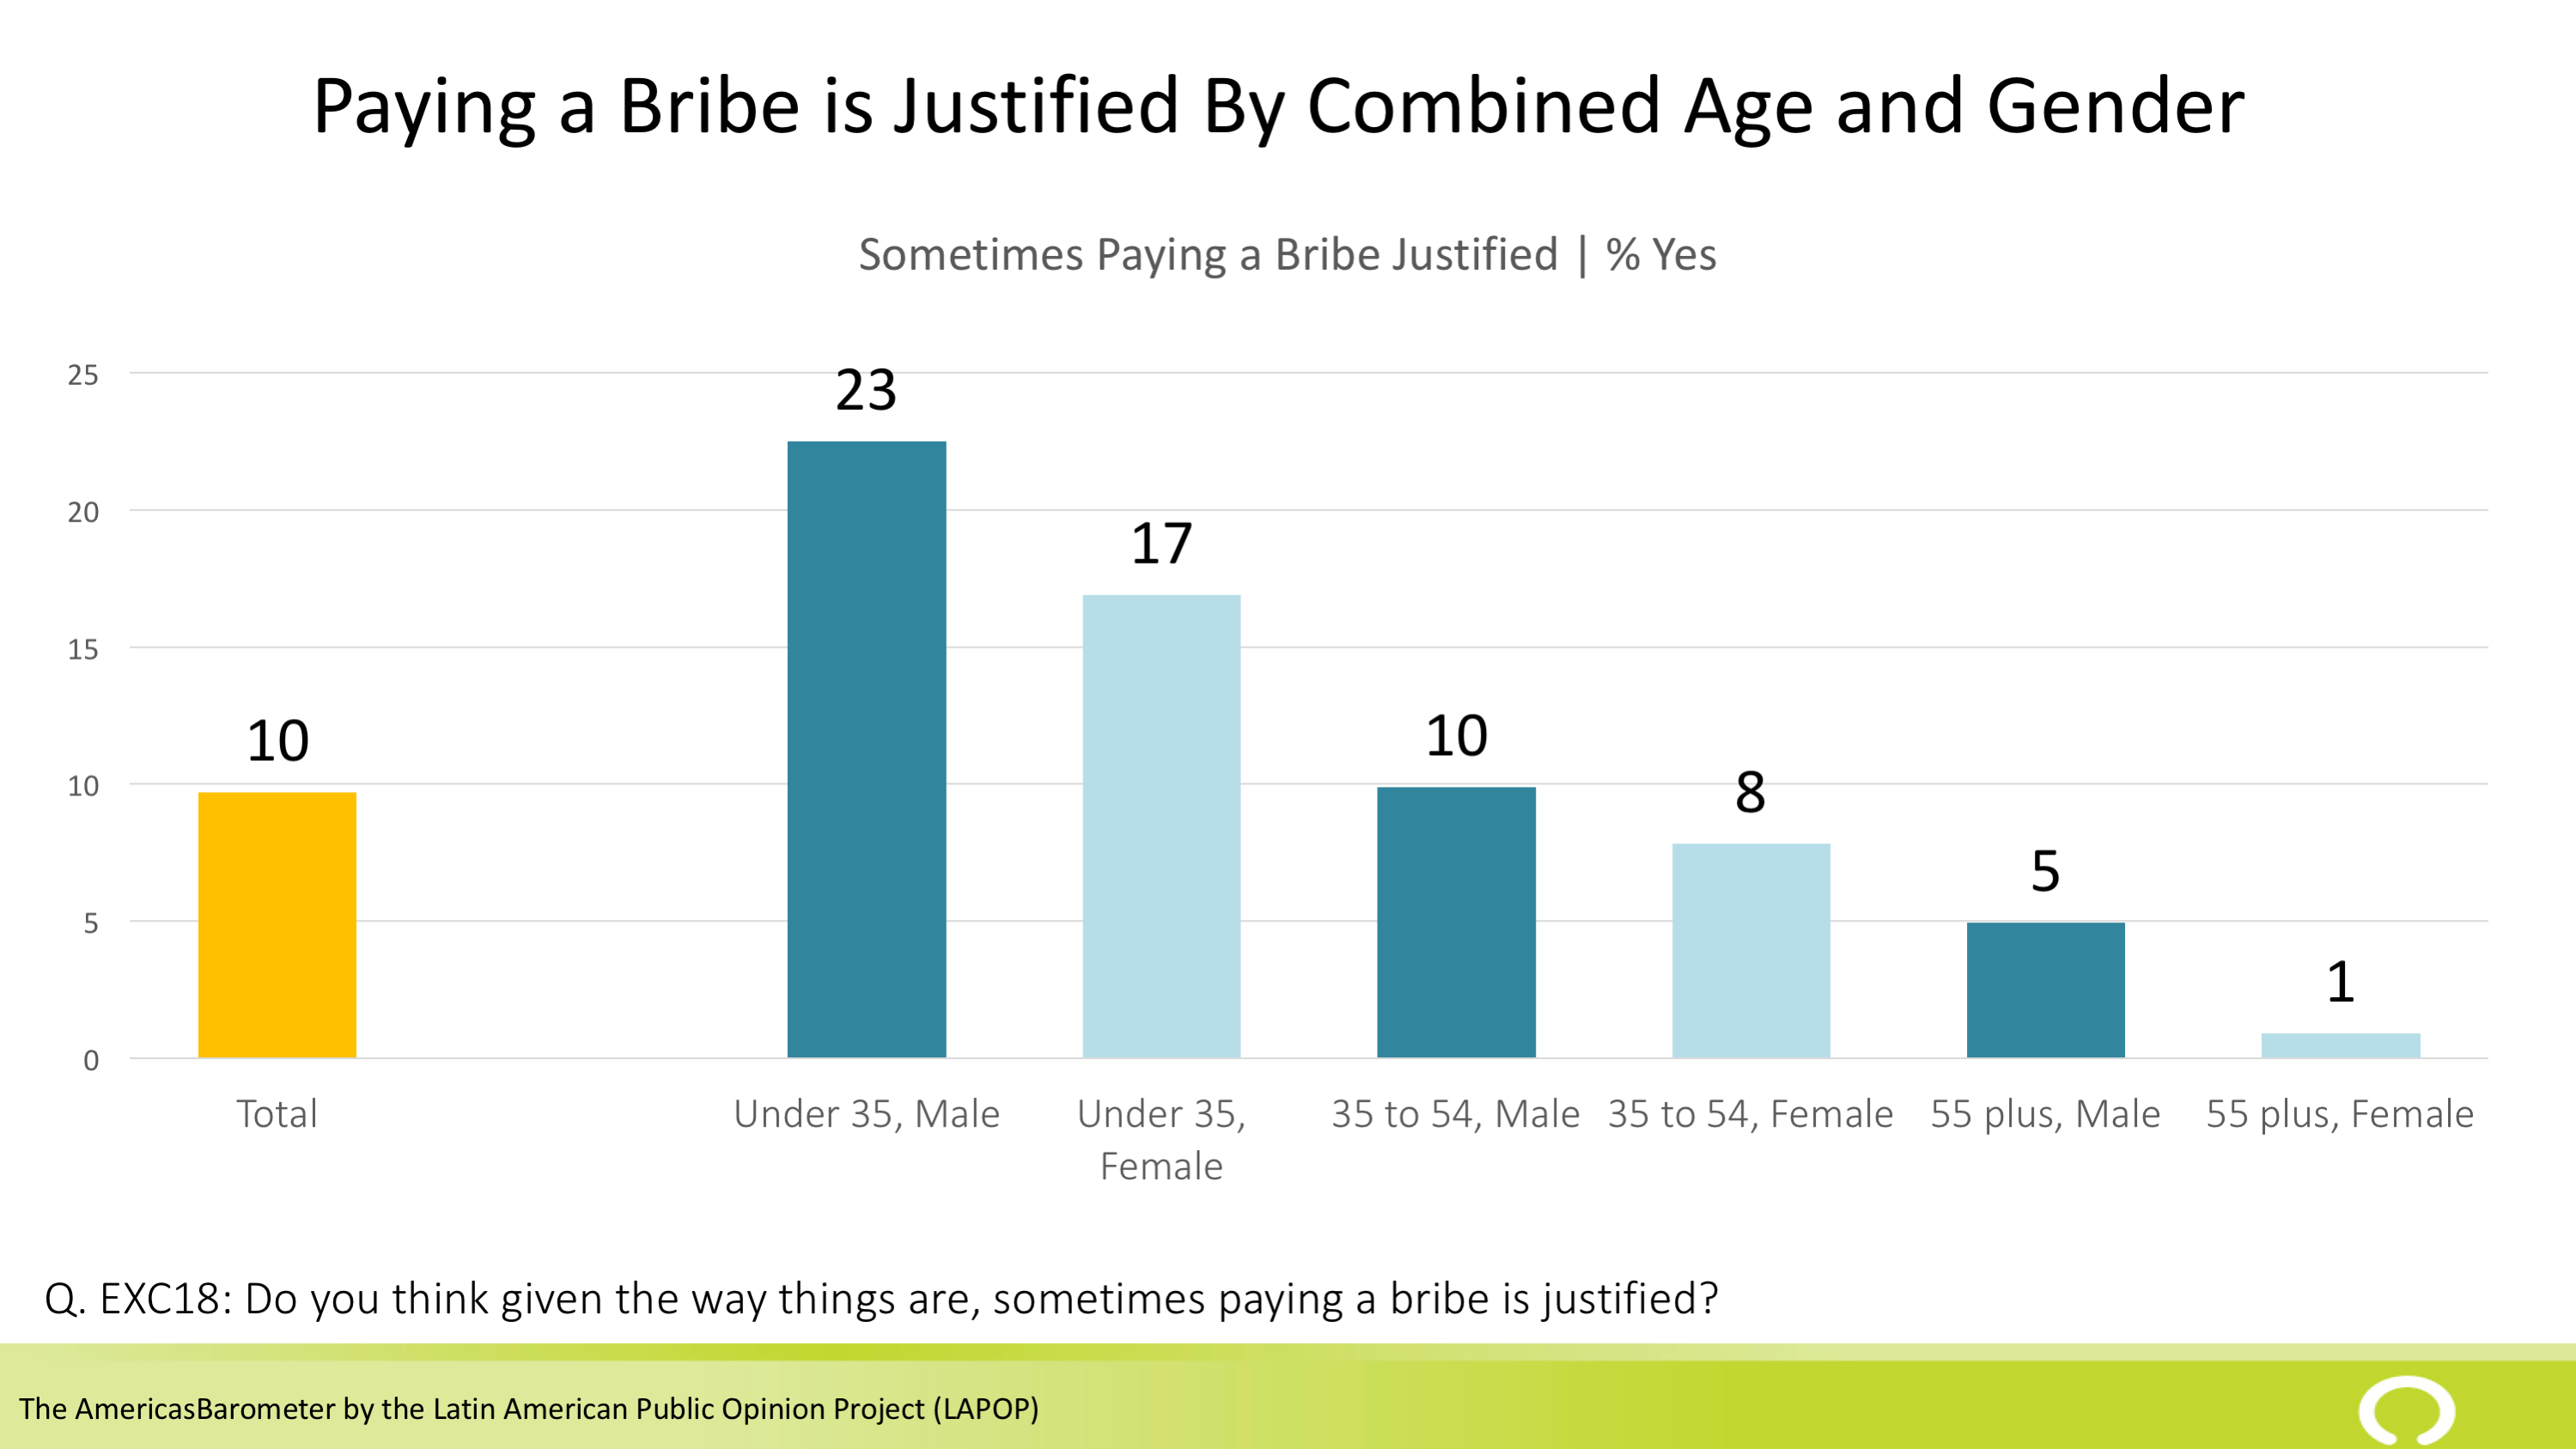
There are key demographic differences in the 2017 results. Men and younger people are much more likely to view a bribe as being justified and young men are particularly likely to hold this view.
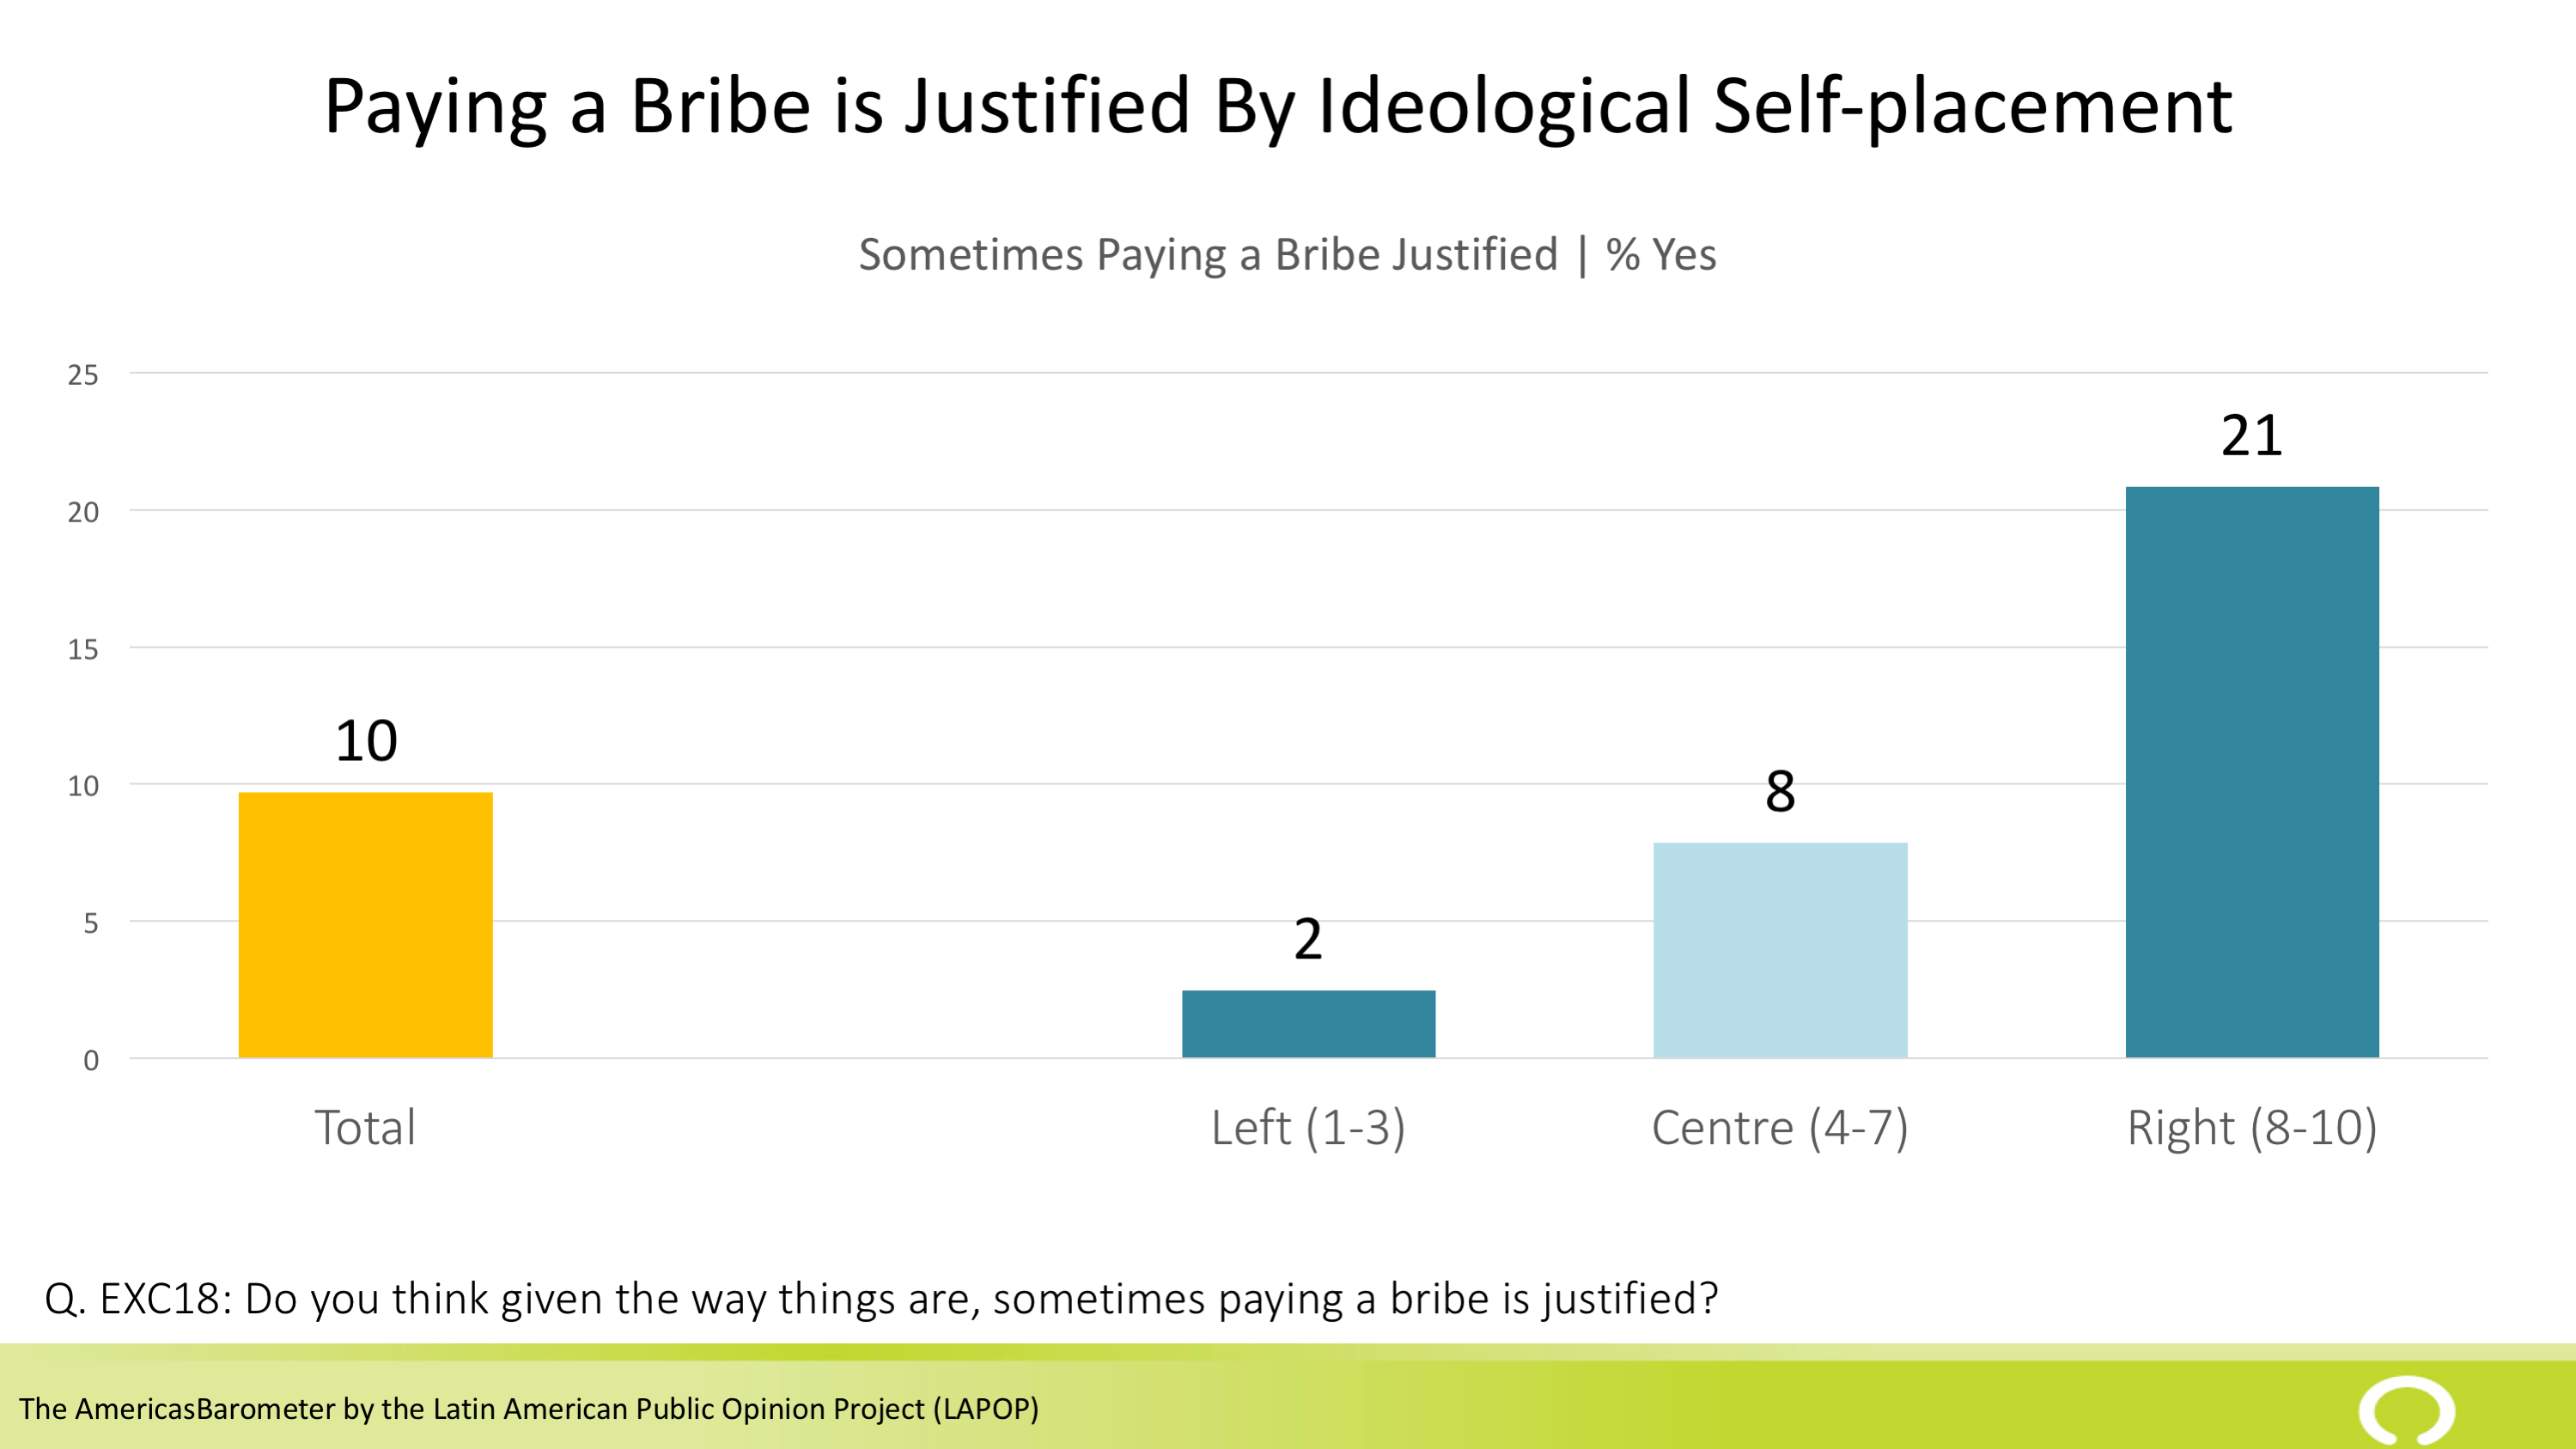
In addition to the age and gender differences, those who self-identify on the right or conservative side of a left-right dimension are much more likely to think bribes are justified.
Implications
Comparatively speaking, our public institutions are beacons of fairness. People are rarely asked for bribes and 9 in 10 don’t think bribes are justified, so they are (a) unlikely to offer one and (b) unlikely to be willing to pay one.
It is not clear from the results whether the acceptability of bribes is driven by an egocentric world view that views my personal happiness over social norms of appropriate social behaviour or a recognition of how some organizations/institutions operate. Nevertheless, a world view that accepts bribery as normal or part of business is likely to shape how Canadians perceive and think about public officials. As a future post will discuss, many Canadians think that there is a lot of corruption among politicians and public officials.
Source: The AmericasBarometer by the Latin American Public Opinion Project (LAPOP), www.LapopSurveys.org. LAPOR is not responsible for the analysis and interpretation of the results.
- 2017 — online survey conducted between March 24 and April 5, 2017; n=1511.
- 2014 — online survey conducted between June 22 and July 1, 2014; n=1517.
- 2012 — online survey conducted between May 15 to May 22, 2012; n=1501.
- 2010 — online survey conducted between April 30 and May 11, 2010; n=1500.
Report — The Political Culture of Democracy in the Americas, 2016/17 (August 2017)