
In the abstract, Canadians value free trade. A recent global Ipsos poll shows that Canada is the 8th most supportive of free trade of 24 countries polled. This is a very strong endorsement of the idea of trade.
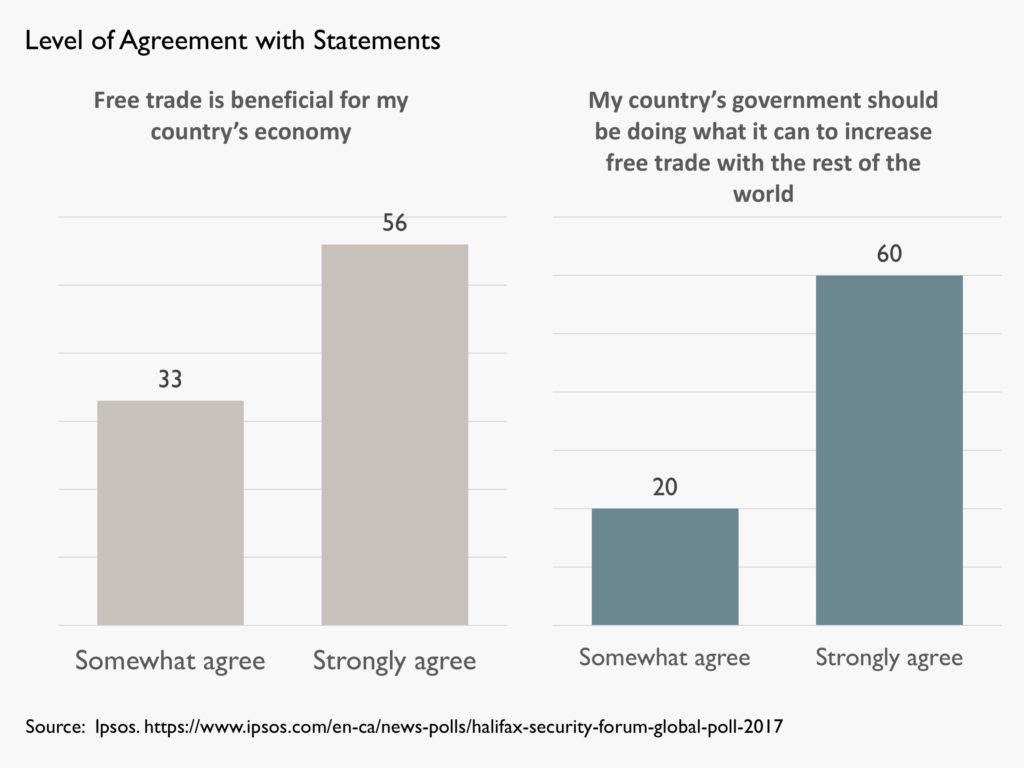
- Fully 89% either strongly agree (56%) or somewhat agree (33%) that “Free trade is beneficial for my country’s economy.”
-
80% agree that “My country’s government should be doing what it can to increase free trade with the rest of the world.”
The challenge, of course, is that trade in these questions is an abstraction. The embracing of free trade by Canadians has established this as a “value” that may or may not be a priority when it comes to specific trade relationship or agreements.
About the Ipsos Study:
These are some of the findings of an Ipsos poll conducted between September 22 and October 6, 2017, on behalf of the Halifax Security Forum. The survey was conducted with 18,594 respondents in 24 countries around the world via the Ipsos Online Panel system. The countries reporting herein are Argentina, Australia, Belgium, Brazil, Canada, China, France, Great Britain, Germany, Hungary, India, Italy, Japan, Mexico, Peru, Poland, Russia, Saudi Arabia, South Africa, South Korea, Spain, Sweden, Turkey and the United States of America. The survey was conducted with an international sample of 18,594 adults aged 18-64 in the US and Canada, and age 16-64 in all other countries. Approximately 1000+ individuals participated on a country by country basis via the Ipsos Online Panel except for Argentina, Belgium, Hungary, India, Mexico, Peru, Poland, Russia, Saudi Arabia, South Africa, South Korea, Sweden and Turkey, which each had a sample of approximately 500. Weighting was employed to balance demographics and ensure that the sample’s composition reflects the adult population according to the most recent country Census data, and to provide results that approximate the sample universe. A survey with an unweighted probability sample of 1,000 and a 100% response rate would have an estimated margin of error of +/-3.1. For a sample of 500 it would be +/- 4.5 percentage points. All sample surveys and polls may be subject to other sources of error, including, but not limited to coverage error, and measurement error.