
The 2019 federal election exacerbated regional tensions in Canada. While regional premiers were already opposed to key federal policies (e.g. carbon tax), the electoral system exaggerated the lack of government support in key regions. And, in a world characterized by populist and other anti-government uprisings on the one hand and increasing economic inequality, should we be worried about how democracy itself is working. A review of satisfaction with democracy, shows a mixed picture.
The AmericasBarometer surveys provide a useful picture of how Canadians view their democratic system. There have been 7 Canadian surveys as part of the AmericasBaromoter tracking. Many of the key questions about democracy have been tracked since 2006.
Satisfaction with How Democracy Works
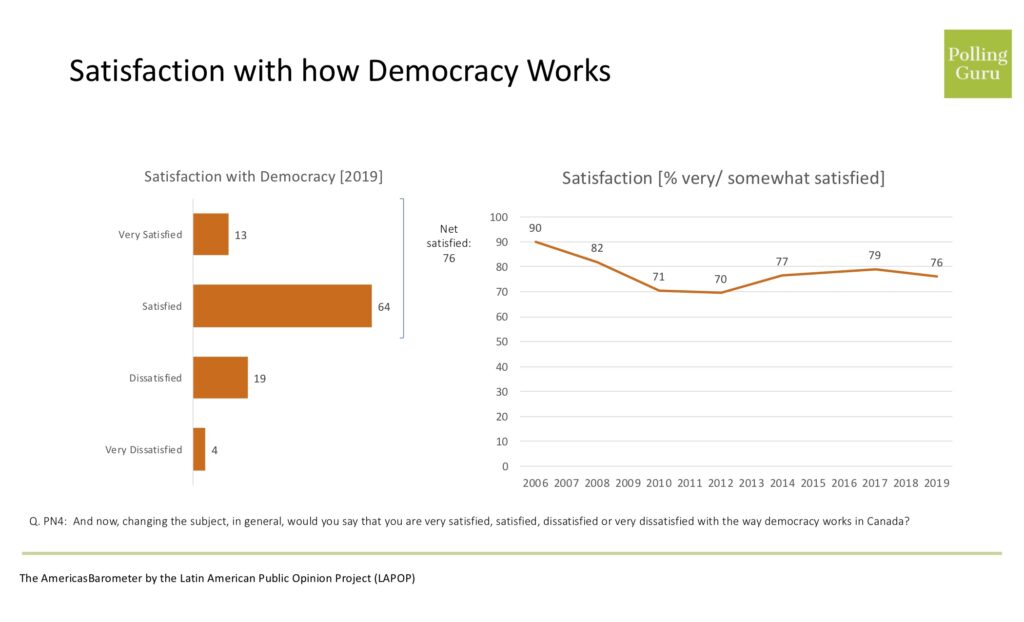
The simplest approach to determine if democracy is working is to ask how satisfied Canadians are. Seventy-six per cent of Canadians are at least somewhat satisfied with how democracy works. While this is a significant level of regime support, only 13% are very satisfied. The bulk of people offer a more satisficing response. They are merely satisfied.
While satisfaction was the highest in 2006, both the 2006 and 2008 surveys were conducted by phone rather than online. There is a reasonable chance the differences are a methodological artifact. Since hitting a low of 70% at least somewhat satisfied, there has been moderate improvement. Does this mean democracy is valued here? Why did satisfaction rise between 2012 and 2018 before falling back slightly? Is a public more satisfied with the government of the day responsible?
A good place to start is with sociodemographic indicators. Demographically, one of the strongest predictors of satisfaction is education. Seven in ten (71%) of those with high school or less education are at least somewhat satisfied. In comparison, 84% of those with a post graduate degree are satisfied.
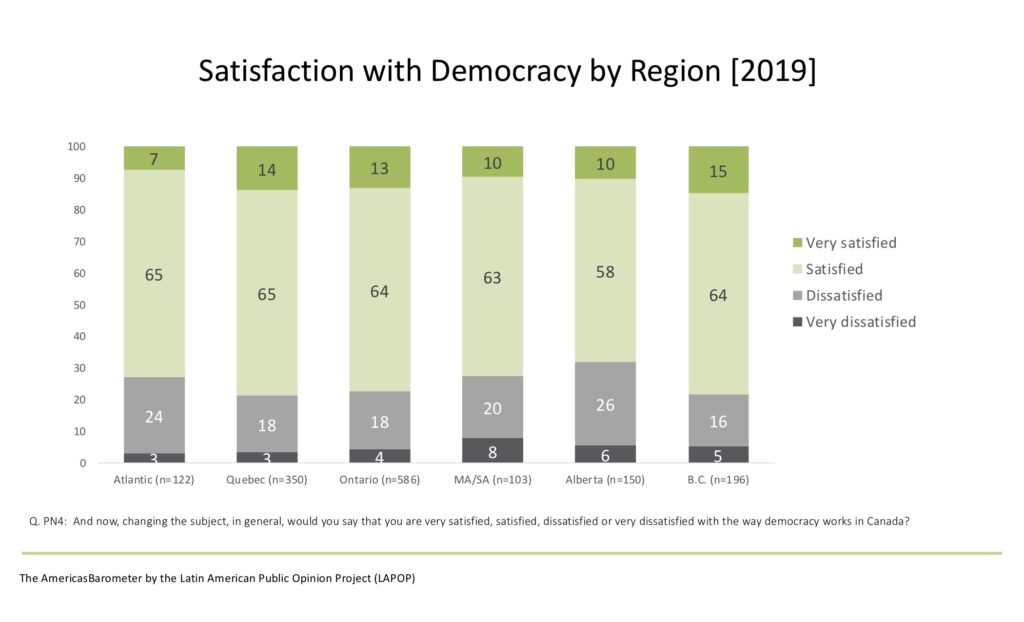
It is also evident that there are significant regional differences in satisfaction with democracy. Here Alberta is the least satisfied (32% dissatisfied). Note that this is before the 2019 federal election. Quebec, Ontario and B.C. are the least dissatisfied. The outcome of the 2019 election may have further altered this picture.
One of the challenges of satisfaction with democracy is that it is not a straightforward concept. Canache and Seligson (2001) found that the “item suffers from severe flaws—indeed, fatal flaws in our judgment” [525]. The problem with the satisfaction question is that satisfaction is multi-dimensional. In fact, they find that the meaning varies across people and nations. This makes it difficult to make cross-national comparisons. It also makes it hard to be sure that a given level of satisfaction is a sign of democratic stability.
Evidence in Canada suggests that satisfaction with democracy is related to the outcome of elections with those on the winning side more likely to be satisfied (Blais and Gélineau, 2007). Clearly, there is fertile ground to explore why or why not some people are satisfied and others are not.
More fundamentally, Plattner (2010) argues that by definition democratic systems will produce dissatisfaction because of the inherent tension in trying to simultaneously have majority rule and protect minorities. In this sense, the idea of satisfaction being an indicator of regime or system support makes no sense.
Satisfaction with Democracy as a Judgement about the Current Political Outcomes
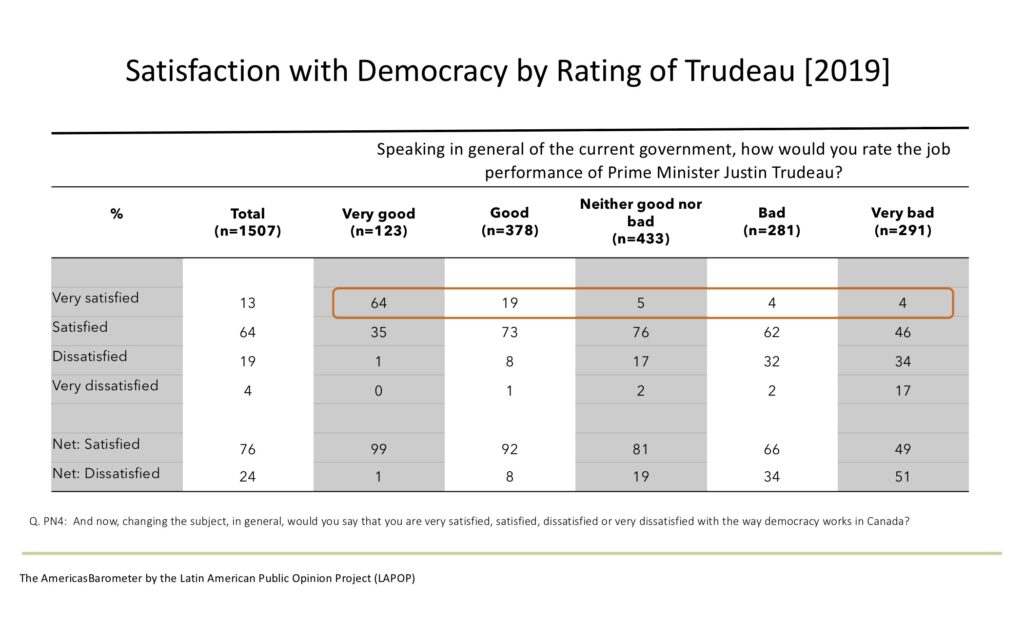
The AmericasBarometer has a number of political situation indicators. Most notably, vote intention in the previous federal election and the current evaluation of the Prime Minister (Trudeau). The table below tests the hypothesis that satisfaction is higher among those people who evaluate the Prime Minister positively.
Although only 8% think Trudeau is doing a very good job, those who do are more satisfied (64% are very satisfied). Moving from a very good job to a very bad job lowers the percentage who are at least somewhat satisfied from 99% to 49%. Over half of those who think that Trudeau is doing a bad job are not satisfied with democracy in Canada.
The correlation between evaluation of Trudeau and satisfaction with democracy is 0.49. A correlation of 1 is perfect correlation. A regression analysis that only includes rating Trudeau as an independent variable has an adjusted-R2 of 0.24.
It is clear that the concept of satisfaction with democracy has current political evaluations of leaders etc. built-in. This makes it harder to use the concept as an indicator of democratic values or regime support. We can, however, know that when satisfaction declines it serves as a useful barometer that the party system has lost touch with voters.
Others Explanatory Variables for Understanding Satisfaction
The notion that satisfaction with democracy is an indicator of incumbent support is interesting. Of course, it also raises the possibility that other individual-level perceptions may drive satisfaction. These could include:
- Economic perceptions – both egocentric (how am I doing) and sociotropic (how is the economy overall).
- Personal life satisfaction that may include economic as well as non-economic factors.
- Ideology such as the position of the person on a left-right scale.
- Political interest.
- Interpersonal trust.
Gratefully, the AmericasBarometer includes questions that tap these dimensions.
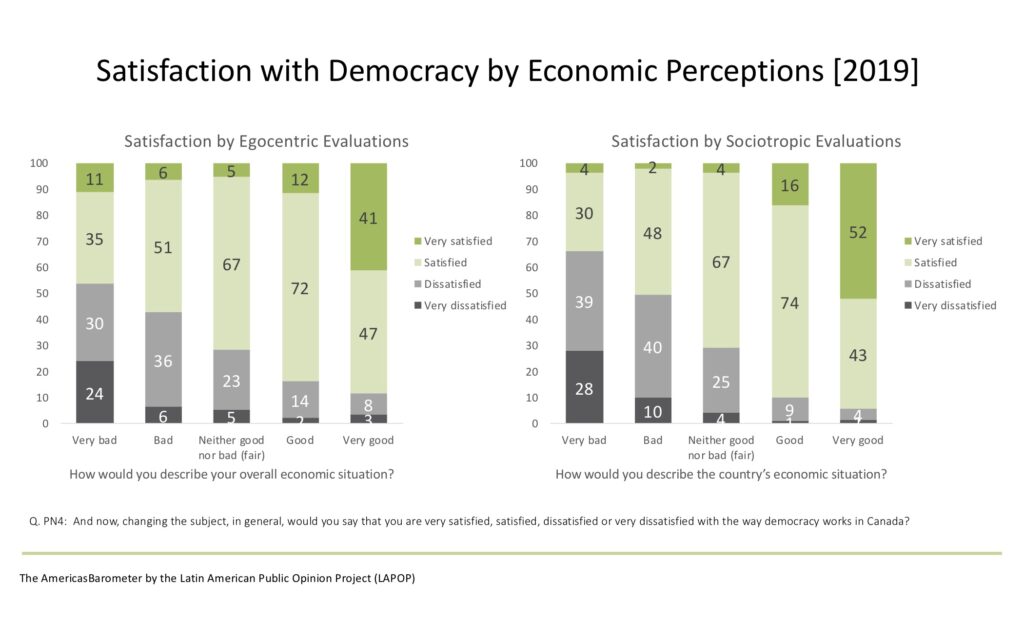
Economic perceptions clearly predict overall satisfaction with democracy. Those who feel that their personal situation is very good are satisfied. A majority of those who think their situation is very bad are not satisfied. A similar pattern is evident for how satisfied people are with their life (not shown).
Left-right ideology is not a strong predictor of satisfaction. Political interest is, however a strong predictor of satisfaction. Interpersonal trust is also a strong predictor of satisfaction.
A Regression Analysis
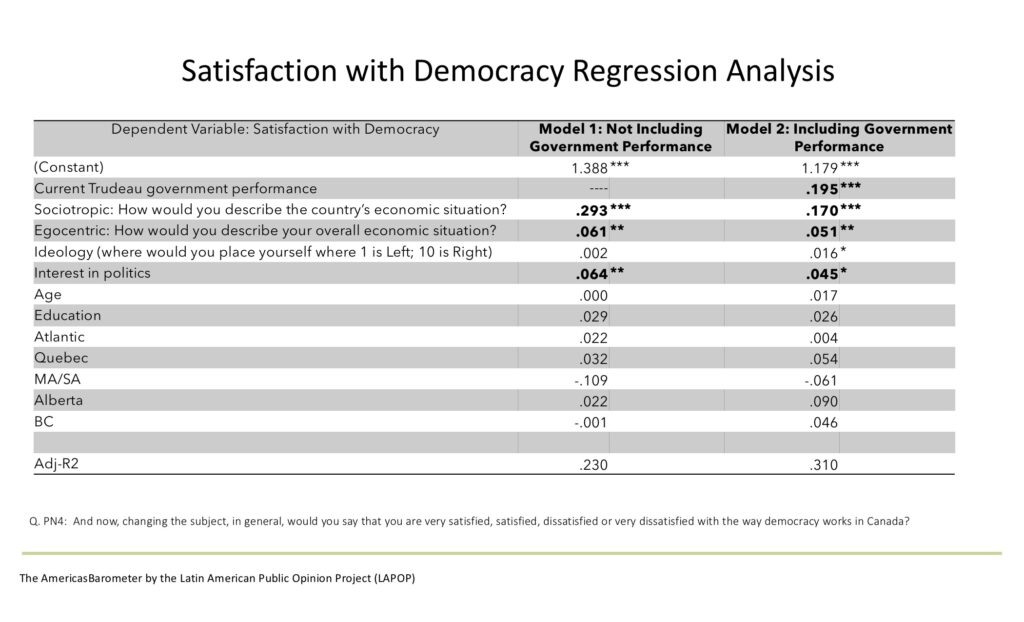
Regression analysis can help us understand the competing drivers of satisfaction. With the 4-point satisfaction scale, we report the results of two models. The first does not include evaluations of the Trudeau government. The second one does.
Model 1 — economic perceptions are critical here. Sociotropic concerns (that is, evaluations of the economy as a whole) have a larger impact than egocentric ones. Political interest is also significant. One can see, however, that education, and regional impacts disappear once we control for interest, ideology and economic perceptions.
Model 2 — economic perceptions continue to be important but no longer the most important. Current evaluations of the Trudeau government are now the top driver of satisfaction. Interest continues to be important while identifying on the right tends to be associated with more satisfaction. This latter point, may capture something not covered in our model to this point. The impact of feeling like the system is not treating you fairly at the benefit of the rich.
Final Thoughts
The majority of Canadians are satisfied with democracy but it is far from universal. In fact, the evidence here continues to show that the question is only partially about the resonance of democracy for Canadians. The public answers this question with some key current things on their minds.
Those with more interest in politics tend to be more satisfied but dissatisfaction is being driven by clear perceived negative outcomes. Most notably, the feeling the economy overall is poor drives people to be dissatisfied. Personal economic hardship also leads to dissatisfaction. And, while some of this is captured in evaluations of the Prime Minister, a government pursuing policies that are out of touch with some of the public can also produce dissatisfaction. The fact that the Alberta impact is explained away by other factors is important here.
The importance of embedding performance evaluations of government. The fact that satisfaction captures short-term performance evaluations is important to note. On the one hand, you can expect any government to alienate some voters. And this might be getting worse given the divineness of politics today. Satisfaction does then serve as an early warning sign of trouble. On the other hand, over the past ten years (under governments of different stripes), the overall satisfaction has remained fairly constant. It will be interesting to note if we see major changes in satisfaction following the federal election last fall.
Populism is the under considered area. One area that we did not explore here is the idea of populism. In other words, the idea that satisfaction with democracy and even democracy itself is threatened by the idea that the public or common sense should play a bigger role in decision-making. The idea that some people are being alienated. It is a topic we will pick up on in a future post.
A better measure of democratic values. Thankfully, there are a few other options that can be used to capture the value Canadians place on democracy. In the AmericasBarometer, another questions was whether people would prefer democracy over non-democratic approaches. Here the clear majority (75%) think democracy is preferable to any other form of government. That said, 15% are somewhat indifferent (for me it doesn’t matter) or would actually see some situations where authoritarian government would be better. Perhaps troubling signs that at any time, there is an appetite for a populist revolt.
The Americas Barometer by the Latin American Public Opinion Project (LAPOP). http://www.LapopSurveys.org
We thank the Latin American Public Opinion Project (LAPOP) and its major supporters (the United States Agency for International Development, the Inter-American Development Bank, and Vanderbilt University) for making the data available.
Sources
Blais, A., & Gélineau, F. (2007). Winning, losing and satisfaction with democracy. Political Studies, 55(2), 425–441. http://doi.org/10.1111/j.1467-9248.2007.00659.x
Canache, D., Mondak, J. J., & Seligson, M. A. (2001). Meaning and Measurement in Cross-national Research on Satisfaction with Democracy. Public Opinion Quarterly, 65(4), 506–528. http://doi.org/10.2307/3078752
Plattner, M. F. (2010). Populism, pluralism, and liberal democracy. Journal of Democracy, 21(1), 81–92.